


Newsletter Subscribe
Join thousands of readers who get our Sunday Briefing: one email, five essential stories, zero fluff. Subscribe NOW!
Join thousands of readers who get our Sunday Briefing: one email, five essential stories, zero fluff. Subscribe NOW!
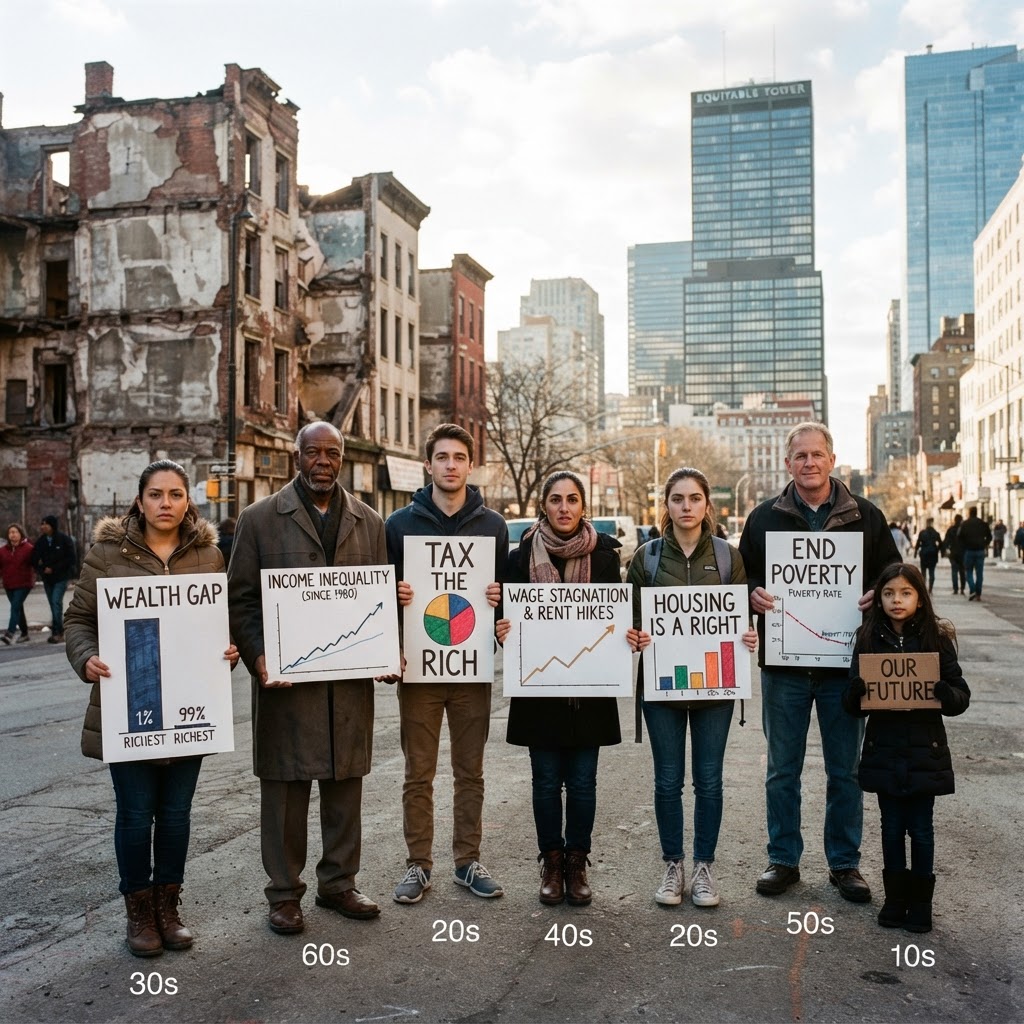
Economic inequality data often misrepresents reality, masking systemic issues. We dive deep into the Gini coefficient, wealth concentration, and the myth of meritocracy, exploring how data fails to capture human experiences.
Talking Points:
We obsess over numbers, don’t we? A statistic here, a percentage there, as though they hold all the answers to economic inequality. With the richest 10% holding approximately 70% of all wealth in the U.S., you’d think those figures would spark an outrage. But what do we actually do with this information? Do we truly grasp the implications of such extreme wealth distribution? More importantly, does the data even tell the full story? With economic inequality data in the spotlight, it’s time to unpack the reality behind the numbers, and it ain’t pretty.
Talking Points:
Ah, the Gini coefficient. A tidy little number that’s become the go-to for measuring income inequality. But here’s the catch: it’s like looking at a Picasso painting without understanding the chaotic strokes behind it. Two countries can have the same Gini score, yet the income inequality might feel worlds apart. Imagine being rich in a country with a low Gini score—your well being might feel downright secure while others around you struggle.
Let’s face it: the Gini coefficient does not account for capital accumulation or class stratification. It fails to highlight who actually owns resources and who doesn’t. It offers a sanitized version of economic data, one that shields us from the harsh truths lurking beneath.
Talking Points:
Everyone loves a feel-good story about the underdog rising against all odds, right? Classic meritocracy at its finest. Except, like many fairy tales, this story doesn’t have much basis in reality. Recent reports show economic mobility in the U.S. declining significantly, with the chances of making it big increasingly hinging on where you were born or the bank account of your parents. It’s disheartening, to say the least.
I remember when my buddy—financially secure, Ivy League graduate—landed a plush job versus another friend of mine, who tirelessly hustled through community college while juggling two jobs. The difference? Connections and financial backing.
When you really think about it, the myth of meritocracy becomes a heavy weight that perpetuates a cycle of economic disparity. It serves the top 1% while diluting the struggles of the 60% left behind.
Talking Points:
Ever ponder how much money is floating around in offshore accounts? Try this on for size: approximately 12.48% of global GDP was stashed away in 2023, largely untaxed. We’re talking about the top 0.1% holding roughly 80% of all untaxed offshore wealth. How does this not send alarm bells ringing?
When we trace the money, we uncover that these tax havens contribute to the widening global income gap—a rich-poor chasm so broad it almost feels insurmountable. The legitimation of wealth concentration erodes trust in fiscal policy outcomes as well as public institutions. Suddenly, the gap isn’t just numbers in a textbook; it translates into real-world hardships for millions.
Talking Points:
A lot of folks might look at economic data and nod in agreement but miss the point entirely: policies rooted in these figures fail to acknowledge human lives. Fiscal policy outcomes often favor those with political clout or wealth, while the poor end up as collateral damage.
I think back to a policy change in my city around housing tax breaks. Big developers reaped benefits while working families got squeezed, adjusting their budgets just to keep a roof over their heads. We’ve turned human lives into mere data points—indicators that mean little when you aren’t living through it.
Talking Points:
Now let’s get real about data manipulation. It’s not just private entities that have a vested interest in how numbers are portrayed; surprisingly, governments can do the same. From countries with weaker democratic institutions to those rich in power, economic data often serves political agendas. The real tragedy? Our perception of economic health becomes distorted.
When the numbers serve the narrative of those in power, they obscure the reality on the ground. Misleading unemployment rates or inflated GDP growth figures create an illusion of progress, all while people are struggling to make ends meet. It’s a charade that cannot be ignored.
Talking Points:
Remember the days when middle-class jobs offered security and a pathway upward? Thanks to AI and automation, those notions are becoming quaint. Reports show that sectors previously considered the backbone of the middle class are under siege. You blink, and suddenly, your job feels precarious.
I first noticed it in my local grocery store. Machines began replacing checkout clerks, and it was jarring. The truth is, this technological displacement doesn’t discriminate—it hits the educated and uneducated alike, obliterating job security and leaving economic precariousness in its wake.
Talking Points:
Okay, so we’ve established some serious issues with economic inequality data, but what about how we’re collecting it? The declining response rates to surveys mean that data can become skewed and less representative. Think about it; who’s filling out those surveys? The most engaged individuals—often the wealthier ones.
Unless we rethink how we gather economic statistics, we run the risk of repeating the same mistakes moving forward. Realistic data needs diverse voices. Until that happens, we’re left scratching our heads, relying on flawed metrics and distorted narratives.
Talking Points:
Visible economic disparities lead to more than just financial frustrations; they create a psychological environment rife with stress and tension. Every time you scroll through social media and see those luxury vacation selfies or opulent homes, it hits hard. The emotional impact can seep into your psyche, making you feel less than.
It’s not just individual experiences; communities feel the strain too. Frustration runs high, confidence dwindles. Layers of societal inequality can increase feelings of hopelessness, perpetuating cycles that make it even tougher to climb any ladders. It’s a heavy emotional burden that’s seldom addressed in traditional economic data.
Talking Points:
In the end, those numbers are just that—numbers. They can’t conjure the human experience behind economic inequality. It’s high time we shift the conversation from mere data collection to a serious examination of systemic accountability.
Recognize the systemic barriers that keep too many stuck in the economic quicksand. Engage in discourse that questions the narratives shaped by power structures. Let’s talk solutions rather than just numbers. If you’ve faced these issues or have insights to share, drop your thoughts in the comments below.
The Gini coefficient measures income inequality within a population. A score of 0 means perfect equality, while a score of 1 implies maximum inequality. It provides insight into economic disparities but doesn’t tell the complete story of wealth distribution.
Wealth concentration can exacerbate economic disparities, making it challenging for lower-income individuals to access opportunities like education, healthcare, and affordable housing. This can lead to a cycle of poverty and limited social mobility.
Automation and AI are displacing traditional jobs, often targeting middle-class professions. This leads to uncertainty and job loss for many people, contributing to broader economic precariousness and income inequality.
Declining survey response rates can bias economic data, making it less representative of the overall population. If certain groups are underrepresented, the data may misinform policymakers and exacerbate existing inequalities.
Engaging in community discussions, advocating for policies that promote equity, and staying informed about economic issues can empower individuals to challenge systemic barriers and contribute to meaningful change.